FDR and Multiple Comparisons in Microarray Experiments
One motivating biological application in DNA microarray experiments is to detect differential gene expression. That is, to identify genes expression changes under different treatment conditions or among different types of cell samples (e.g., genotypes).
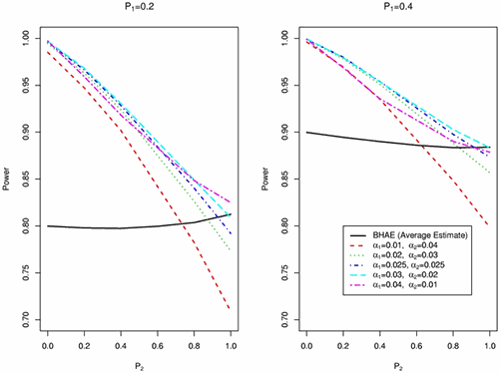
With tens of thousands of genes on the array, the traditional familywise error rate controlling procedures such as Bonferroni correction procedure may be too conservative. In 1995, Benjamini and Hochberg proposed a new measure of error rate, the false discovery rate (FDR) which is the expected proportion of false rejections among all rejections, and a FDR controlling procedure for independent test statistics. If the estimate of the proportion of true null hypotheses is incorporated into Benjamini and Hochberg's FDR controlling procedure, the FDR can be controlled close to a pre-chosen significance level. When pairwise comparisons of more than two treatment conditions are of interest in a microarray experiment with a large number of genes, Jiang (2004) has proposed a two-step multiple comparison procedure that can be employed such that the power to detect differentially expressed genes, while controlling the FDR below a desired significance level, will be higher than a one-step procedure.
References:
Y. Benjamini and Y. Hochberg. Controlling the false discovery rate: a practical and powerful approach to multiple testing. Journal of the Royal Statistical Society, Series B, 57:289-300, 1995.
H. Jiang. A two-step procedure for multiple pairwise comparisons in microarray experiments. Ph.D dissertation, Purdue University, West Lafayette, Indiana, 2004.

Figure 1: Power comparisons of the two-step multiple comparison procedure with different combinations of a1 and a2 in Step 1 and Step 2, respectively, and the one-step multiple comparison procedure BHAE (Benjamini and Hochberg's FDR controlling procedure with incorporation of estimate of the proportion of true null hypotheses by the proposed average estimate approach) at FDR significance level a = 0.05 (solid line). There are five combinations of a1 and a2: a1 = 0.01 and a2 = 0.04 (short dashed line), a1 = 0.02 and a2 = 0.03 (dotted line), a1 = 0.025 and a2 = 0.025 (dotted and short dashed line), a1 = 0.03 and a2 = 0.02 (long dashed line), and a1 = 0.04 and a2 = 0.01 (dotted and long dashed line). Here P1 is the proportion of genes having a treatment effect; P2 is the proportion of genes which have a treatment effect having one treatment mean different but the other two the same.