Statistical Analyses of the Cosmic Microwave Background (CMB)
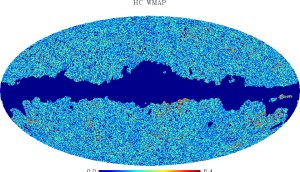
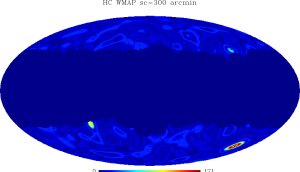
Maps of the temperature fluctuations of the Cosmic Microwave Background (CMB) provide a wealth of information about the evolution and properties of the Universe. The statistical distribution of the temperature fluctuations of the CMB is directly connected with processes that took place during the early stages of the evolution of the universe. These processes are responsible for the consequent formation and distribution of the structures that populate the universe at present, such as galaxies and clusters of galaxies.
Our group works on developing algorithms that will help us identifying the statistical distribution of the observed CMB maps. This effort serves a double purpose. (1) Under the assumption of the Standard Inflationary model of the very early universe, the distribution of the CMB temperature fluctuations is expected to be Gaussian. Detection of non-Gaussianity will therefore question this model and will set constraints on any alternative ones. (2) Observations of the sky in the microwave region of the spectrum do not only provide data on the CMB but also on the emission of our Galaxy, other galaxies and clusters of galaxies. In addition, instrumental noise is as well present in the collected data. Our full understanding of the CMB is based on a "clean" recovery of the CMB signal. Any detections of non-Gaussianity could as well come from the presence of any residuals or be the result of unwanted data processing effects.
Members:
- Laura Cayón
- Jiashun Jin, Carnegie Mellon University
Publications:
-
M. Cruz, L. Cayón, E. Martinez-Gonzalez, P. Vielva and J. Jin. The Non-Gaussian Cold Spot in the 3-Year WMAP Data. Astrophysical Journal, 2006, submitted.
-
L. Cayón, A.J. Banday, T. Jaffe, H.K. Eriksen, F.K. Hansen, K.M. Gorski and J. Jin. No Higher Criticism of the Bianchi Corrected WMAP Data. Monthly Notices of the Royal Astronomical Society 369 (2006) 598-602.
-
L. Cayón, J. Jin and A. Treaster. Higher Criticism Statistic: Detecting and Identifying Non-Gaussianity in the WMAP First Year Data. Monthly Notices of the Royal Astronomical Society 362 (2005) 826-832.