Microarray Analysis
Microarray technologies allow the simultaneous monitoring of gene transcript abundance at a magnitude that allows whole genome assessment of every gene in an organism. When microarray technologies first arrived on the scientific scene, they seemed like such a great idea and the answer for everything -so much data; so many questions to ask, and so fast! Whether one was exploring data or testing a hypothesis, microarray technologies provided a vast amount of data around which many stories were told; some validated by other scientific means, some not. The probability of finding genes that were differentially expressed (i.e., something caused a change in the gene's transcript abundance between conditions) was almost certain, especially if you were testing every gene in the genome (or, at least hundreds), and usually the results were encouraging. But after awhile, and after a bit of thought, the scientific questions quickly turned to questions about whether the observed changes were actual changes in the transcript abundance or just random noise, when and why were statistical experiment design and analysis methods necessary, and to what extent is independent experimental confirmation necessary. A less obvious question for many biologists is what does statistical significance mean when biological significance is at the heart of the application?
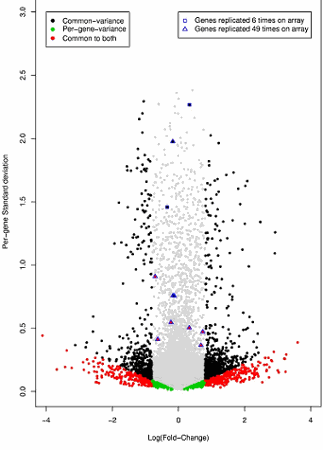
Figure 1: The results from two different analyses of a replicated dye swap experiment (8 hybridizations: 2 biological samples under 2 conditions using reverse labeling) are summarized. The replicated dye swap experiment tests 26,110 unique genes for differential expression. 26,094 of the genes are represented once, 12 are represented 49 times, and 4 are represented 6 times. The first analysis assumes a constant variance (estimated constant variance is 0.1153) across all genes, and uses a one analysis of variance model to provide the statistically significant differential expression as indicated by the black and red data points. The fold change boundary for declaring significant results under the assumption of a common variance is exp(0.80)=2.23. The second analysis estimates a per-gene variance for each gene, and employs an analysis of variance model for each gene which in turn provides evidence for differential expression for that gene. The per-gene results are illustrated by the green and red data points, with a fold change as low as exp(0.18)=1.20 being statistically significant. The red data points provide the intersection of the results when the two different analyses are compared. Data points that are not statistically significant after a Holms multiple comparison correction (alpha=0.05) are indicated in gray. The gene features that benefit from increased replication on the array are illustrated, and demonstrate the level of differential expression that is statistically significant for 6 and 49 replicate gene features.